Children’s socio-economic circumstances are a key lens for understanding disparities in developmental outcomes and access to opportunities. Economic circumstances – from poverty to affluence – are deeply connected to the resources and support systems available to young children. Families’ economic resources influence caregiver wellbeing, child health and nutrition, the home learning environment, and access to quality early learning programmes (ELPs) – all major influences on developmental outcomes.
A core objective of the Thrive by Five Index is to track how the performance gap between children from higher and lower socio-economic groups changes over time. A reliable, valid measure of where children are located on the poverty-wealth spectrum is therefore required to:
- Be a meaningful proxy for socio-economic circumstances;
- Provide valid comparisons over time; and
- Be replicable for future rounds of the Thrive by Five Index.
In the first round of the Thrive by Five Index (2021), monthly ELP fee levels were used as a socioeconomic proxy. Fees offer a practical reflection of what households are likely able to afford within their local context, providing a useful, if imperfect, indicator of relative economic means. Nationally, there were five distinct fee bands of between R0 – R1750+per month. K-means clustering was applied to create these groups, but this produced uneven cluster sizes, with very small groups at the tails.
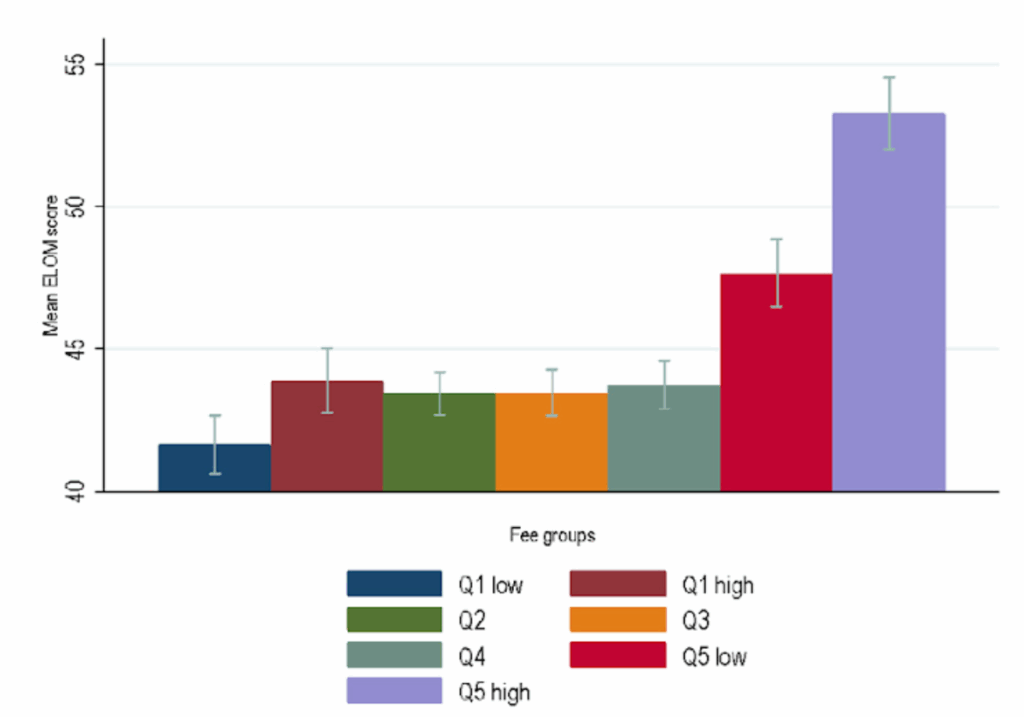
To address these limitations, the 2024 Index adopted a new approach (Working Paper in press). Nearly all ELPs charge fees (97%) with fees ranging from R0–R50 in L1 Low to over R1,690 in L5 High. Monthly ELP fees, reported by principals and validated through cross-checks with parent-reported data (available for 95% of ELPs in the final sample), were also selected as the most appropriate available proxy for children’s socio-economic circumstances. The 2024 Index sample was initially divided into the same five quintiles based on fee levels. However, further analysis revealed important differences within the highest and lowest levels. To reflect this, these two levels were split into low and high sub-groups respectively (L1 Low and L1 High and L5 Low and L5 High), resulting in a total of seven ELP fee groups. Considering both the total ELOM scores and performance across individual ELOM domains, seven fee groups were selected to adequately capture performance gradients, ensure meaningful disaggregation at the lower and upper ends of the fee distribution, and allow for comparability with future rounds of the Thrive by Five Index.
This figure illustrates the performance gradients by fee groups by looking at the average ELOM scores across fee groups.
Average ELOM scores by fee groups
This table presents the minimum and maximum monthly fees charged per level for both the 2021 and 2024 Thrive by Five waves.
| Fee level group | Monthly fee per child (Rands) | |
| Thrive by Five 2021 | Thrive by Five 2024 | |
| Level 1: low | R0-R110 | R0-R50 |
| Level 1: high | R51-R120 | |
| Level 2: | R111-R290 | R121-R240 |
| Level 3: | R291-R750 | R241-R350 |
| Level 4: | R751-R1750 | R351-R800 |
| Level 5: low | R1751+ | R801-R1690 |
| Level 5: high | R1691+ | |